DataLine
AI tool that converts natural language questions into live data visualizations, making data analysis as simple as having a conversation.
Conversational AnalyticsData VisualizationNatural Language QueryBI AssistantAI InsightsData Exploration
DataLine Introduction
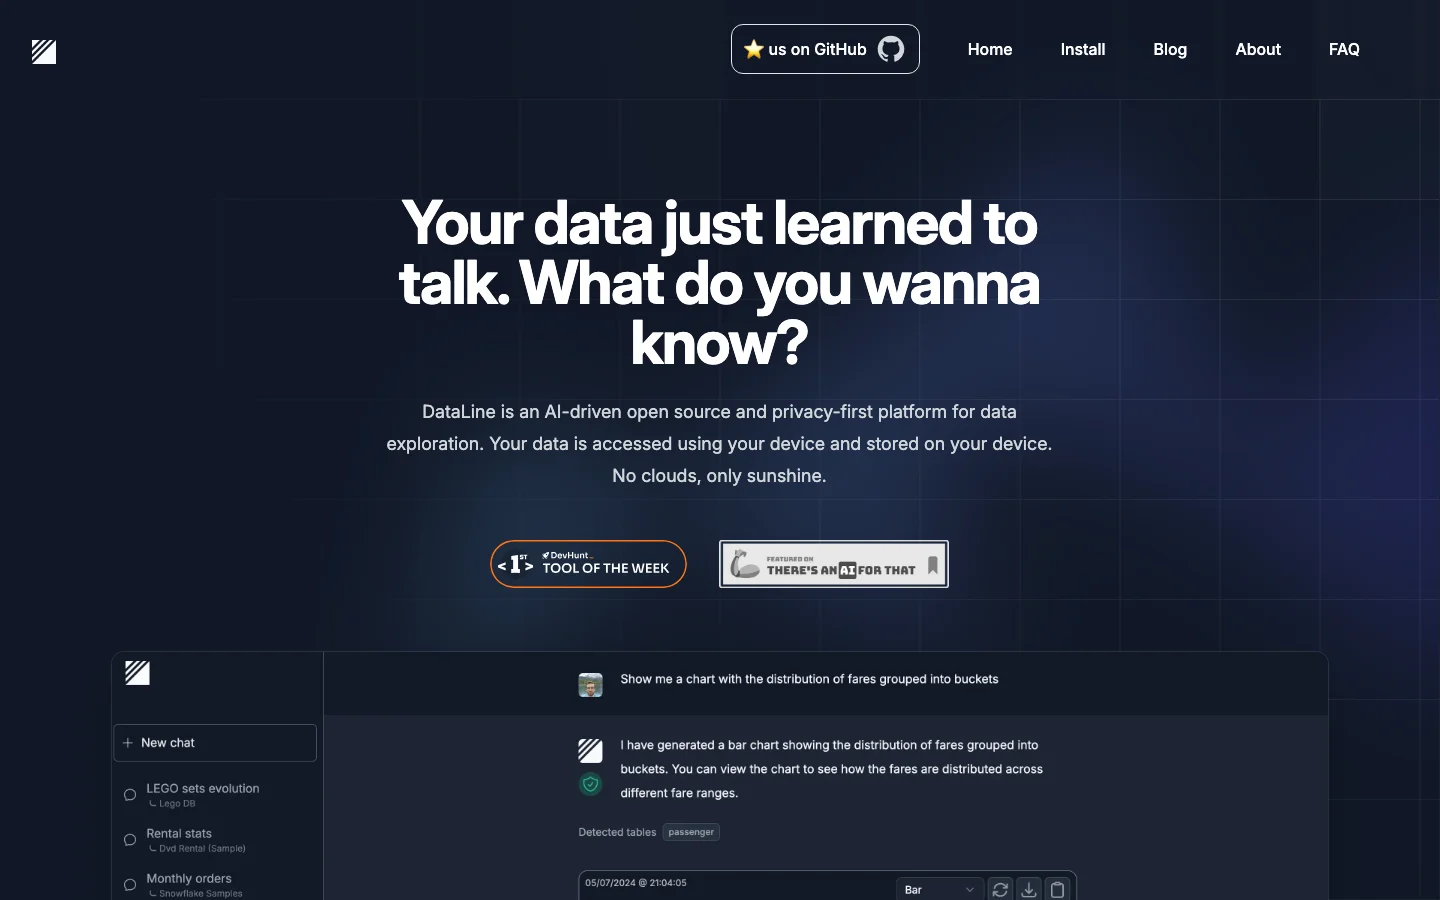
DataLine is a conversational data analytics tool that bridges the gap between curious business users and complex datasets. Instead of building queries or wrestling with pivot tables, you simply ask questions like “Compare revenue growth by month,” and DataLine instantly renders the appropriate visualization. It supports iterative exploration, so you can drill down or change views just by continuing the conversation. DataLine is especially valuable for startups and small teams that need fast, flexible data exploration without dedicated analytics infrastructure.
Key Features
- Generates charts and graphs directly from typed or spoken questions
- Connects to SQL databases, APIs, and uploaded CSV files
- Understands follow-up questions and refines visualizations accordingly
- Supports dashboard creation by stacking multiple question-based widgets
- Exports visualizations as images or embedded interactive charts