
Bricks
Bricks is an AI-powered platform that transforms your spreadsheet data into professional reports, charts, and visual presentations.
AI reportingspreadsheet tooldata visualizationchart makerbusiness intelligenceproductivity platformdocument automation
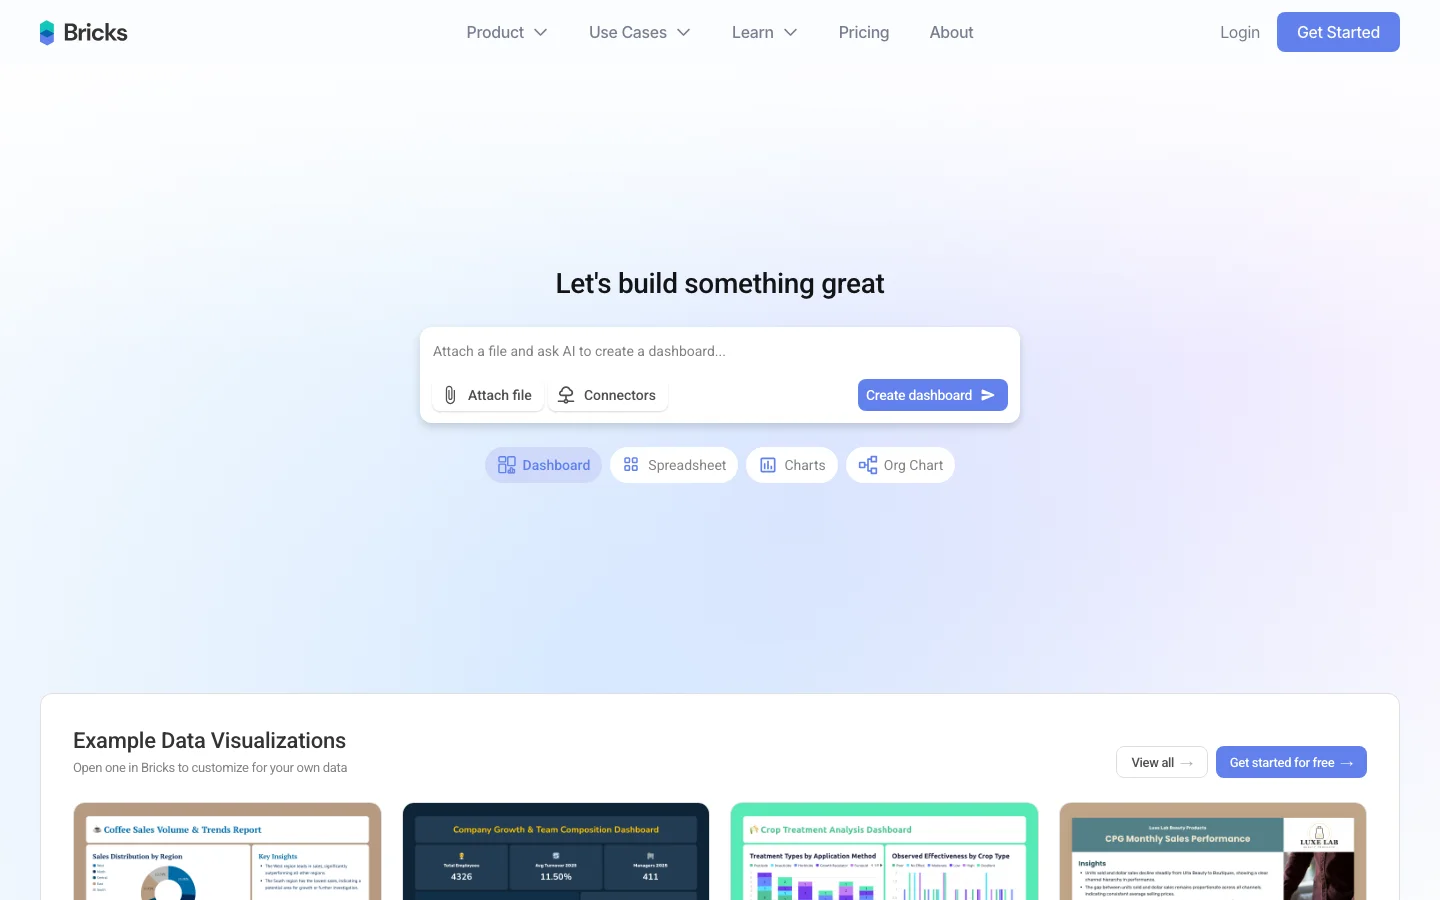
Bricks Introduction
Bricks connects the dots between raw data and polished communication. It understands your spreadsheet data and can instantly produce the visuals and narrative needed for presentations or reports. This eliminates the manual, error-prone process of creating charts in Excel and then copying them to PowerPoint. Bricks is a unified workspace where data, analysis, and presentation coexist, making business reporting dramatically more efficient.
Key Features
- AI creates charts, graphs, and tables from your data
- Generates written reports summarizing spreadsheet insights
- Combines spreadsheets, docs, and presentations in one tool
- Real-time collaboration for teams
- Templates for business reviews, project plans, and more
Alternative Tools
-
Gigasheet Explore Gigasheet on AiToolsList.Tools.
-
 Needle AI Simplify workflow automation and enhance decision-making with seamless data connectivity.
 -
Onvo AI Quickly create custom dashboards and data visualizations using an SDK from multiple data sources.
-
 Sloped Explore Sloped on AiToolsList.Tools.
 -
 AI-Lawyer Instantly automate legal document creation with our professional tool designed for efficiency and accuracy by professionals.
 -
Beautiful.ai Effortlessly create stunning presentations with AI-powered design support.