
Graphy
AI-powered data visualization tool that helps businesses and professionals create interactive charts and dashboards to communicate insights clearly.
Data VisualizationInteractive ChartsDashboard ToolBusiness InsightsAI PresentationVisual Analytics
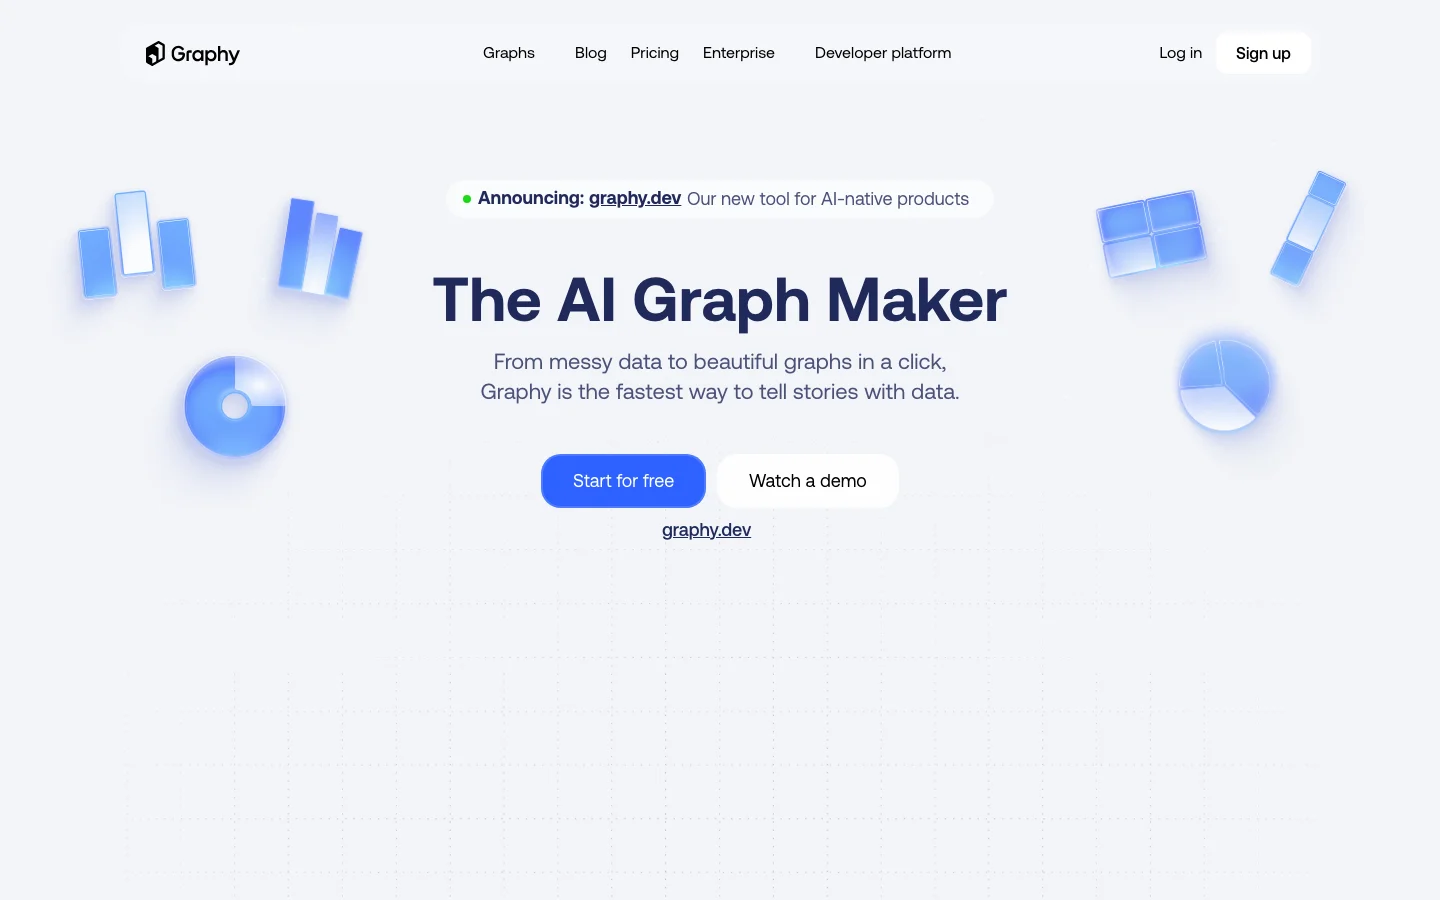
Graphy Introduction
Graphy is an AI-enhanced data visualization platform that helps business analysts, marketers, and managers turn boring spreadsheets into compelling, interactive visual stories. Its AI suggests the most effective chart type for your data and handles formatting, so you can focus on the insights rather than fiddling with design. Graphy supports live data connections and team collaboration, making it a practical tool for anyone who needs to regularly communicate data-driven findings to stakeholders in a clear, professional manner.
Key Features
- Generates visualizations from raw data with AI-recommended chart types
- Supports interactive dashboards with drill-down and filtering
- Collaborates with team members in real-time on visual reports
- Connects to databases, Google Sheets, and CSV files automatically
- Exports visuals as images, PDFs, or embeddable interactive widgets
Alternative Tools
-
DataLine Convert conversational questions into data visualizations and insights.
-
 InfraNodus Advanced visual AI platform that analyzes text to drive actionable insights.
 -
 Speak Ai Automate transcription, sentiment analysis, and data visualization from audio, video, and text to save time and gain insights.
 -
 Magic Dash Visualize data and insights in new ways.
 -
 Abel Effortlessly review legal documents with our tool designed for attorneys.
 -
 Aftercare Effortlessly gather feedback with follow-up questions.