
ToDiagram
ToDiagram transforms raw data into interactive, editable diagrams, aiding analysis and presentations.
data to diagramvisualization toolinteractive chartsAI diagrammingbusiness analysisdata presentationproductivity app
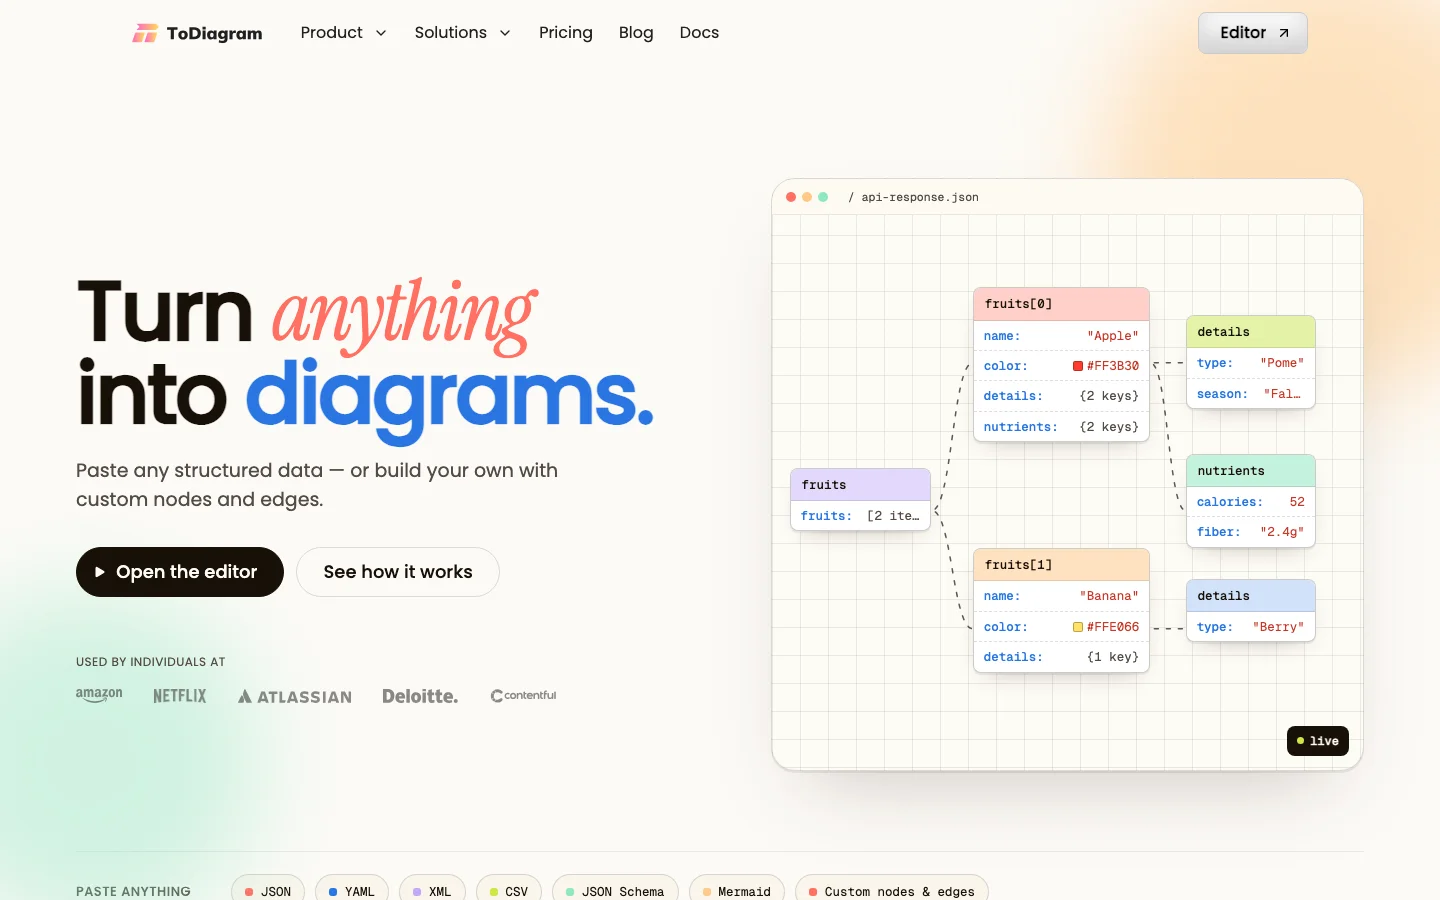
ToDiagram Introduction
ToDiagram streamlines the creation of professional diagrams from data that would otherwise sit in static tables. Analysts and managers can import a dataset and watch as the platform suggests the most meaningful visual structure. The resulting diagrams are fully interactive, allowing viewers to explore relationships and hierarchies on their own. This tool is especially useful for preparing board presentations, system architecture documents, and organizational planning where data-driven diagrams need to stay in sync with source spreadsheets.
Key Features
- One-click conversion of CSV or spreadsheet data to diagrams
- Editable nodes and connectors for customizing layouts
- Interactive filtering and drill-down capabilities
- Support for flowcharts, org charts, and network diagrams
- Export to PDF, SVG, or embed in reports
Alternative Tools
-
AI Notebook An app designed for efficient note-taking with voice transcription capabilities to help organize and summarize information from various multimedia sources.
-
 Beedone Effortlessly turn your daily routines into engaging habits for smarter task management and increased productivity.
 -
Beloga A tool to enhance research, streamline note-taking, and spark idea generation.
-
CubeOne AI A tool that helps create and deliver presentations through chat.
-
EchoNote Convert voice recordings into organized text notes easily.
-
 Floutwork Discover a productivity app designed to help you focus and streamline your tasks for better work efficiency.